- Bounce off the weekly
- SFP
- Weekly below
Sunday, April 24, 2022


Weekly Plan April 25th, 2022
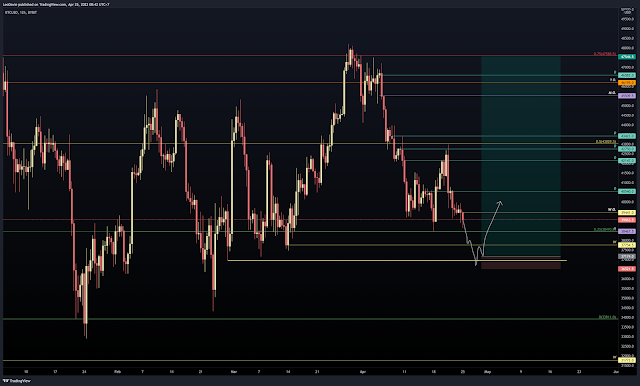
On a higher time frame, BTC is bullish. It broke the high, and now just back testing the weekly OB that lead to the high.

On 12h time frame, still looks kinda bullish. Higher high twice, and now just back testing the 12hr OB and POC. Below it, we have sell stops at around $37000, also a HVN.
The first area I'm looking at is be the SFP at around $37000. Quite bullish if we reverse here, take a lot of liquidity and still make higher low. The only thing is that would still be above the .25 of the range we're in. So I will only long if there's a clear SFP. If not, wait for it to come down to lower to below .25 region.


On 4h time frame, we have a range and we're at the bottom of the range now. Some liquidity built up at the bottom of the range. We can sweep it for a quick move up to the top of the range. This could be a scalp. And top of this range offers scalp shorts. Trade this range.

Monday, April 18, 2022
Weekly Plan Apr 19th
Last night, we saw a short squeeze. The PA was very technical. Bounced from the monthly. Then as the price fills the SPs, and came down, it rested at .618 and new shorts were aggressively coming in. It did a fake out to .702 to lure in more shorts then shot back up to squeeze out all of them!
Now I'm treating this as a range from weekly open to daily 41.3k.

Thursday, April 14, 2022
April 14 trade
Only took 1 trade today. A scalp right before bed.
Based off CCTR template. Saw some absorption (price stays the same with CVD moved up.

Wednesday, April 13, 2022
April 13 trade
My losing trade last night was a fomo trade.
Price impulsed up, no reaction at nspoc. It got a small rejection before npoc at 41k. I shorted the cc retracement of the rejection. What I didn't see was bullish divergence. It was a fomo trade, I just didn't want to miss the short and omitted the fact that price moved up created sp, still quite impulsive at the moment.


Tuesday, April 12, 2022
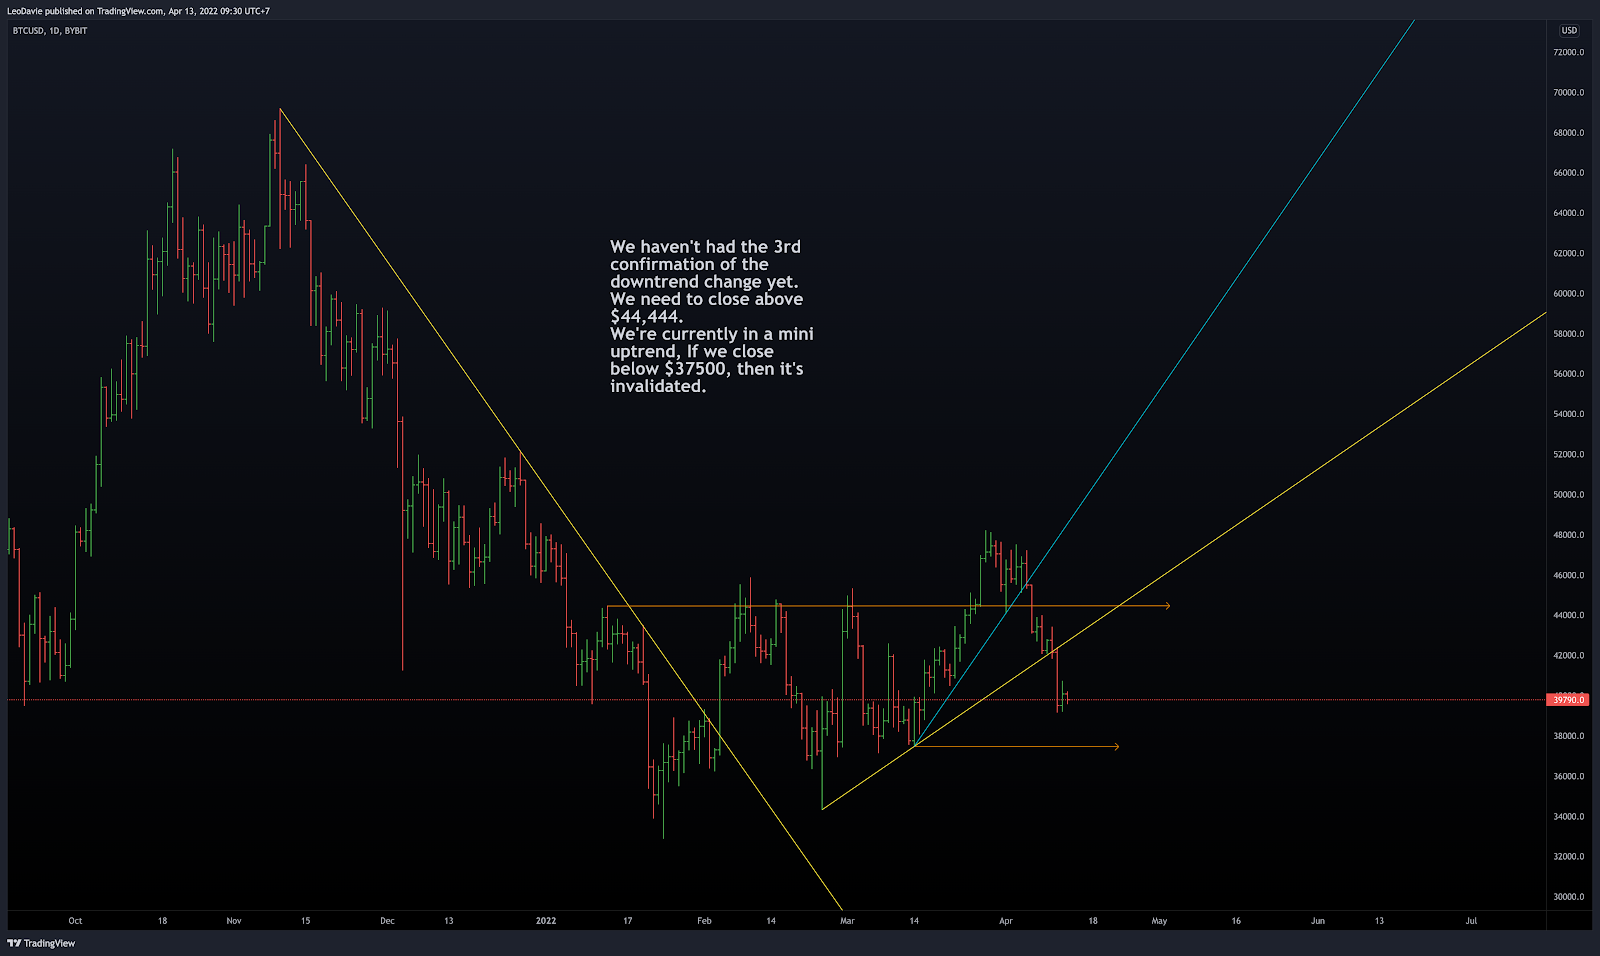
Trend Reverse Confirmations by Victor Sperandeo
"In the case of an uptrend line, you draw the line from the lowest low to the highest low immediately preceding the highest high, making sure that the connecting point you select does not result in the trend line passing through any prices betwewen the two points.
One the trend line is broken, I then look for an unsuccessful test of the recent high. This failure may take the form of prices reversing below the previous high or, in some instances, prices might actually penetrate the previous high by a modest amount and then break. In the case where prices penetrate the previous high, a pull back below that high would serve as confirmation of a failed test of the high. The third and final confirmation of a trend change would be the downside penetration of the most recent relative low."
1st example: 52k


Current Price Action:
Weekly Bullish Trading Plan
We're in this parallel channel with deviation. In the past, it deviated around 7%. So now, price could break down, grab the liquidity, tap the weekly, SFP all the lows. There's a previous range POC at 36910.

Subscribe to:
Posts (Atom)